If you ever need to work with data tables in a Django project, you'll eventually need the ability to transpose or pivot your data. Transposing your data simply changes the way it is viewed, where each row of data becomes a column. Transposing data works well with defined sets of data, e.g. years, quaters, day of the week, etc.
Assuming you already have a Django project up and running, lets dive into two examples of how to pivot your data. I'll use student test scores and another data set (which was my use-case when finding this solution) that looks at some other arbitrary date-based data.
Transpose
Lets view some different ways of transposing your data.
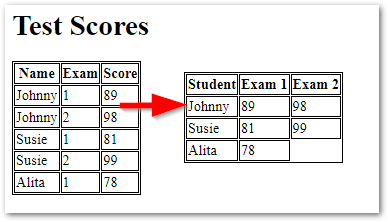
Student Test Scores
We have a TestScore model with that data that looks like this:
| Student | Exam | Score|
| --------| -----|------|
| Jonny   | 1    | 89   |
| Johnny  | 2    | 98   |
| Susie   | 1    | 81   |
| Susie   | 2    | 99   |
| Alita   | 1    | 78   |
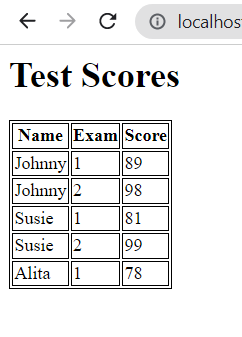
Lets see the typical way to view this data in a table in HTML.
views.py
from django.shortcuts import render
from core.models import TestScore
# Create your views here.

def test_scores(request):
    exams = TestScore.objects.all()
    return render(request, 'core/results.html', {'exams':exams})
results.html
<h1>Test Scores</h1>

<style>
    table {
        border: 1px solid black;
    }
    table tr, td, th {
        border: 1px solid black;
    }
</style>

<table>
    <!-- Create your table headers manually -->
    <thead>
        <th>Name</th>
        <th>Exam</th>
        <th>Score</th>
    </thead>
    <tbody>
        <!-- Loop through your queryset -->
        {% for exam in exams %}
        <tr>
            <td> {{ exam.student }}</td>
            <td> {{ exam.exam }}</td>
            <td> {{ exam.score }}</td>
        </tr>
        {% endfor %}
    </tbody>
</table>
Results in this basic table:
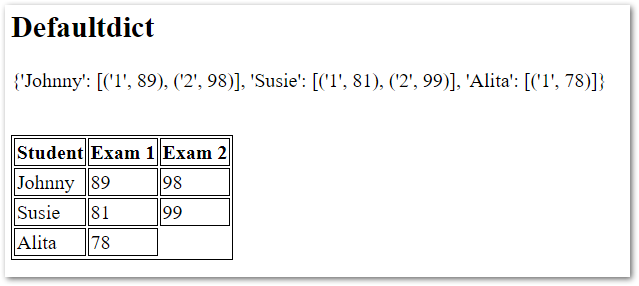
The defaultdict way
A defaultdict is a dictionary-like object. Its benefit is an easy way to create a default value for a given key if it does not already exist in the dictionary.
views.py
from django.shortcuts import render
from core.models import TestScore
# Create your views here.

from collections import defaultdict ## NEW

def test_scores(request):
    # Regular `ol table
    exams = TestScore.objects.all()

    # With defaultdict
    exams_transposed_dd = defaultdict(list)
    for exam in exams:                                                        ## New
        exams_transposed_dd[exam.student].append((exam.exam, exam.score)   )  ## New

    return render(request,'core/results.html',
                {'exams':exams,
                'exams_transposed_dd':dict(exams_transposed_dd)})  ## New
For each exam, I am adding the student's name as a key to the defauldict. For its value, a list, I am appending a tuple of the test number and score for each record for that student (the test numbers are just for troubleshooting at this point and to make sure order is maintained). The tuple values are accessed by index, e.g. exam.0 or exam.1.
results.html
<h1>Test Scores</h1>

...

<h2>Defaultdict</h2>
{{ exams_transposed_dd }}
<table>
    <thead>
        <th>Student</th>
        <th>Exam 1</th>
        <th>Exam 2</th>
    </thead>
    <tbody>
        {% for student, exams in exams_transposed_dd.items %}
        <tr>
            <td>{{student}}</td>
                {% for exam in exams %}
                <td>{{exam.1}}</td>
                {% endfor %}
        </tr>
        {% endfor %}
    </tbody>
</table>
There's a problem with the above table—we still have our table headers hard-coded. This is fine if you know exactly what your queryset contains, e.g.: exams = TestScore.objects.filter(exam__lte=2). Otherwise you'll need to figure out the length of columns to display in your template based on the largest amount of test results you get back for a particular student.
There are many ways to do this. We can call max() on the values of the dictionary. Pass that to the template then create a <th> for each header.
views.py
def test_scores(request):

    ...

    cols = max(exams_transposed_dd.values()) ## New

    return render(request,'core/results.html',
                {'exams':exams,
                'exams_transposed_dd':dict(exams_transposed_dd),
                'cols':cols})  ## New
results.html
...
    <thead>
        <th>Student</th>
        {% for col in cols %}
            <th>Exam {{col.0}}</th>
        {% endfor %}
    </thead>
...
The list and zip way
views.py
results.html
The pandas way
views.py
results.py
Pivot and Pivot-Table
THIRD-PARTY PACKAGES
django-pivot
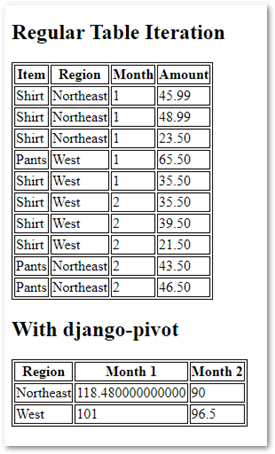
This package is a wrapper for the Django ORM. You could write your own ORM queries and get the same results, but django-pivot makes it easier to read and come back to. Only use django-pivot if you want aggregation on the values of the data you are pivoting (e.g. sum of quarterly profits).
pip install django-pivot- Add
django_pivotto yourINSTALLED_APPSinsettings.py - Create a new database Model and load with some dummy data:
class ItemSold(models.Model):
    item = models.CharField(max_length=255)
    region = models.CharField(max_length=255)
    month = models.IntegerField()
    amount = models.DecimalField(max_digits=6, decimal_places=2)

Profit.objects.create(item="Shirt", region="Northeast", month=1, amount=45.99)
Profit.objects.create(item="Shirt", region="Northeast", month=1, amount=48.99)
...
| Item  | Region    | Month | Amount |
|-------|-----------|-------|--------|
| Shirt | Northeast | 1     | 45.99  |
| Shirt | Northeast | 1     | 48.99  |
| Shirt | Northeast | 1     | 23.50  |
| Pants | West      | 1     | 65.50  |
| Shirt | West      | 1     | 35.50  |
| Shirt | West      | 2     | 35.50  |
| Shirt | West      | 2     | 39.50  |
| Shirt | West      | 2     | 21.50  |
| Pants | Northeast | 2     | 43.50  |
| Pants | Northeast | 2     | 46.50  |
views.py
from django_pivot.pivot import pivot

def items_sold(request):
    items_sold = ItemSold.objects.all()
    items_sold_pivot = pivot(ItemSold, 'region', 'month', 'amount')
    return render(request,'core/results.html',
                {'items_sold':items_sold,'items_sold_pivot':items_sold_pivot})
results.html
<h2>Regular Table Iteration</h2>
<table>
    <thead>
        <th>Item</th>
        <th>Region</th>
        <th>Month</th>
        <th>Amount</th>
    </thead>
    <tbody>
        {% for item in items_sold%}
        <tr>
            <td>{{item.item}}</td>
            <td>{{ item.region }}</td>
            <td>{{ item.month }}</td>
            <td>{{ item.amount }}</td>
        </tr>
        {% endfor %}
    </tbody>
</table>

<h2>With django-pivot</h2>
<br>
<table>
    <thead>
        <th>Region</th>
        <th>Month 1</th>
        <th>Month 2</th>
    </thead>
    <tbody>
        {% for row in items_sold_pivot %}
        <tr>
        {% for value in row.values %}
        <td>{{ value }}</td>
        {% endfor %}
        </tr>
        {% endfor %}
    </tbody>
</table>
pandas
Pandas is a data analysis tool used by data scientists, analysts, and explorers. But it is very easy to use and only a few lines of code generate exactly what we commonly need in data-driven Django projects.
Pandas is not a Django project. Just pip install pandas, import into views.py and you're up and running. Where in Django you work a lot with QuerySets, in pandas you work a lot with DataFrames. A DataFrame is a table-oriented series of data, similar to an Excel table.
Comments
comments powered by Disqus