In this tutorial we're going to look at some data analysis exercises using the Python library pandas. We'll pretend that we're a non-profit agency with a few reporting requirements: provide monthly reports of total volunteer hours, and report on volunteers that fall short of volunteer hour obligations. The data we'll be using is an Excel file where each row is the name of the volunteer, the date of service, and how many minutes they volunteered:
Monthly Attendance
First we'll import Pandas, Numpy, and calendar. You may have to pip install pandas, numpy
>>> import pandas as pd
>>> import numpy as np
>>> import calendar
Then load the data file into a variable df as pandas will create a DataFrame from your data. Since we will be doing a lot of work with the date column in our Excel file, we're going to include the parse_dates parameter:
>>> df = pd.read_excel('volunteerdata.xlsx', parse_dates=['Date'])```
To get the total minutes of volunteer time for ALL volunteers for ALL data:
>>> df['Minutes'].sum() #21715```
Now we want a sum of the total volunteer hours by month, so we use groupby on the Date column of our dataframe, and we convert the month to the month name using month_name('en')
>>> df.groupby(df['Date'].dt.month_name('en'))['Minutes'].sum()
Date
February    10520
March       11195
Name: Minutes, dtype: int64
And now to include a subtotal per volunteer per month, we pass in a list of what we want to groupby, this time the Date and Volunteer Name column from our dataframe:
>>> df.groupby([df['Date'].dt.month_name('en'), df['Volunteer Name']])['Minutes'].sum()
Date      Volunteer Name
February  Frank            5280
          Sally      5240
March     Frank            5950
          Sally      5245
Great! What we want to accomplish now is to add a subtotal for the month, so we can see at-a-glance our monthly totals and the total for each of our volunteers This is a two step process in which we create a pivot table of our dataframe, and then concatenate it back into a dataframe. First to make thing easier, we'll assign the above to variable monthly_totals:
>>> monthly_totals = df.groupby([df['Date'].dt.month_name('en'), df['Volunteer Name']])['Minutes'].sum()
Now, we'll create a Pivot Table out of monthly_totals:
>>> monthly_table = pd.pivot_table(monthly_totals, values=['Minutes'],
                       index=['Date', 'Volunteer Name'],
                       fill_value=0, aggfunc=np.sum, dropna=True)
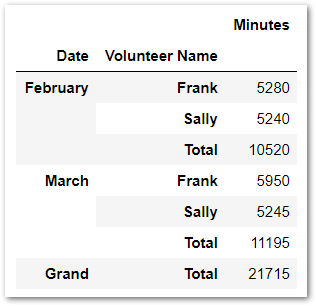
And then concatenate which will return a DataFrame with out subtotals per volunteer and month, as well as a Grand Total:
>>> final_table = pd.concat([
    d.append(d.sum().rename((k, 'Total')))
    for k, d in monthly_table.groupby(level=0)
]).append(monthly_table.sum().rename(('Grand', 'Total')))
Resulting in...
Under Hours
In our pretend non-profit agency the funding sources require that each volunteer give at least 30 hours/week. What we need to do is go back to our original DataFrame and sum our Minutes, grouping by the week. For this exercise, we don't care if the volunteer gave 30+ hours. Instead we want to see what volunteers were under 30 hours and by how much.
Let's check df again and make sure it's our original data:
>>> df.head()
  Volunteer Name  Date      Minutes
0 Sally  2018-02-12  800
1 Sally  2018-02-13  360
2 Sally  2018-02-14  360
3 Sally  2018-02-16  360
4 Sally  2018-02-20  360
Then we have to subtract one week from each Date as we'll want our weekly totals to show the Sunday of that week:
>>> df['Date'] = df['Date'] - pd.to_timedelta(7, unit='d')
Now we'll assign weekly_total to a new DataFrame with weekly totals, accomplished by using Grouper where the 'key' is the column that we want to group, and the 'freq' is set to 'W' for a weekly frequency beginning on Sundays. We then reset_index so that we can sort_values by Date for easier reading. And since we're changing the data, we'll also rename the columns to match the data.
>>> weekly_totals = df.groupby(['Volunteer Name', pd.Grouper(key='Date', freq='W')])['Minutes']\
                    .sum()\
                    .reset_index()\
                    .sort_values('Date')\
                    .rename(index=str,
                            columns={'Volunteer Name':'Name',
                                     'Date':'Week Beginning',
                                     'Minutes':'Total Minutes'})
Resulting in...
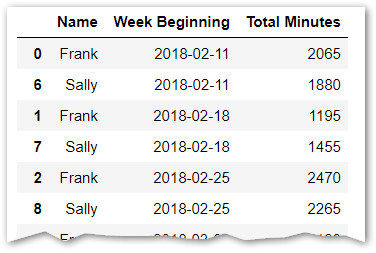
We see that Frank volunteered 2065 minutes in the week beginning Feb 11th, but only 1195 minutes the week beginning Feb 18th. Confirm this by manually looking at the data in the Excel file. If you only have a few volunteers, this is likely all you'll need and you can do your calculations manually with this report. But since you're using Python and pandas, you most likely have lots of volunteers/data, so we need to go a step further and identify all of the volunteers with minutes less than 1800 (30 hours).
Pandas .apply
.apply is a method that will apply a function to each row of data. We'll use a lambda function to check if the total minutes is less than 1800, and if so, display the total minutes under 1800 for each week. We'll store this in a variable called underMinutes
>>> underMinutes = weekly_totals['Minutes'].apply(lambda mins: 1800 - mins if mins < 1800 else (0)).groupby([weekly_totals['Volunteer Name'],weekly_totals['Date']]).sum().reset_index()
>>> underMinutes
   Volunteer Name       Date  Minutes
0          Frank 2018-02-11        0
1          Frank 2018-02-18      605
2          Frank 2018-02-25        0
3          Frank 2018-03-04        0
4          Frank 2018-03-11      450
5          Frank 2018-03-18        0
6          Sally 2018-02-11        0
7          Sally 2018-02-18      345
8          Sally 2018-02-25        0
9          Sally 2018-03-04        0
10         Sally 2018-03-11      100
11         Sally 2018-03-18      725
Now we can easily see that Frank was short in the week of Feb. 18th and March 11th, and Sally was short in the weeks of Feb. 18th, March 11th, and March 18th. We can then apply the same table and concat logic that we previously did to obtain subtotals and grand totals for our report for volunteers with poor attendance.
Comments
comments powered by Disqus